


I. INTRODUCTION AND MOTIVATION
Cuba’s economic and social conditions deteriorated sharply through the summer of 2026. Cubalex, an independent human-rights monitor, documented a record 52 homicides in August, 315 criminal incidents, five deaths in state custody, and 280 distinct repressive events spread across 54 municipalities in 14 provinces (CiberCuba, 2026a). That same month, the Central Bank of Cuba began issuing 10,000- and 20,000-peso banknotes (the two highest denominations the country has ever circulated) against 20.7% year-on-year official inflation and an informal exchange rate that had moved from roughly 60% (from 435 to 698 CUP/USD) between December 2025 and mid-September 2026 (CiberCuba, 2026b). By mid-September, economists were openly debating whether Cuba was sliding toward de facto dollarization as confidence in the peso continued to erode (CiberCuba, 2026c). Currency depreciation, rising prices, and social unrest again appear to be moving together, echoing the pattern around the 2021 Tarea Ordenamiento and the July 11, 2021 protests. Whether that co-movement is systematic and measurable, and whether it can be tracked as it happens rather than reconstructed months later, is the question this paper takes up.
Answering that question in Cuba is unusually difficult by conventional means. Official statistics are sparse, lagged, and in some cases understate the pressures they are meant to capture. Cuba’s official CPI, for instance, runs well below household-level inflation estimates, and no official series tracks social unrest at all. State control over media and a limited independent press further restrict what is knowable about conditions on the ground in real time. This paper starting motivation is that open-source, high-frequency data generated as a byproduct of markets and media, rather than collected through official channels, can partially substitute for the statistics Cuba does not reliably produce, and can do so closer to real time.
Three such sources anchor the analysis. The first is DevTech’s own compiled series on Cuba’s informal CUP/USD exchange rate, a continuously quoted, market-based price that reflects foreign-exchange scarcity and expectations before those pressures show up in an official statistic. The second and third are event datasets: the Global Database of Events, Language, and Tone (GDELT), which underlies this paper’s own instability index; and the Armed Conflict Location & Event Data project (ACLED), which codes political violence and demonstrations from field reporting.
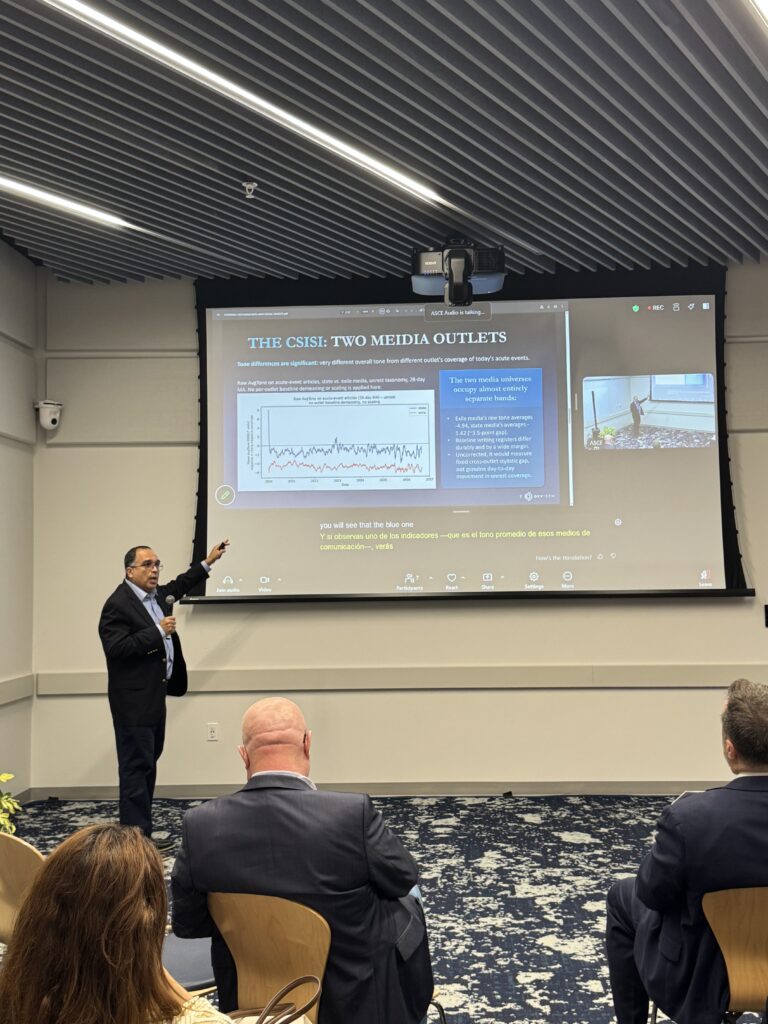
GDELT merits closer attention because it does more than count events. It automatically extracts political and social interactions from global news texts and codes each one to a CAMEO event category, a Goldstein conflict-intensity score, an article-level tone score, and, where the source article permits it, a geographic location. Critically for this paper, GDELT’s source universe spans both Cuba’s state media and its exile/independent media, and each article can be attributed to one or the other. That makes it possible to build two parallel, identically-constructed instability signals from two different vantage points on the same events, rather than one pooled signal that would obscure how the two media environments diverge. The Cuba Sociopolitical Instability Signals Index (CSISI), described in full in Section 3, aggregates GDELT’s event, severity, geographic, persistence, and tone information into a single daily score for each media universe, restricted throughout to the most acute events: protest, coercion, assault, fighting, and mass violence.
With CSISI and the informal exchange-rate series in hand, the remaining design choice was how to relate them. An earlier, daily-frequency approach using bivariate vector autoregressions between each CSISI series and the exchange rate found little that was usable: daily FX shows strong short-run mean reversion consistent with thin-market microstructure noise, and the one Granger-causal result that emerged showed the significant noise the daily data may have. This motivated both aggregating to a weekly frequency, at which the FX series behaves like white noise rather than a bouncing bid-ask spread, and adopting local projections rather than a VAR approach for the empirical analysis. Local projections estimate a separate regression at each forecast horizon instead of propagating one fixed lag structure forward, which lets the response to a depreciation shock differ in size, shape, and timing from the response to an appreciation shock (an asymmetry Section 6 shows to be central to the results) without imposing that asymmetry, or any particular decay pattern, by assumption.
This design contributes four things not yet available together elsewhere in the literature on exchange rates and unrest. First, it operates at weekly frequency, well below the monthly or annual frequency of most existing work connecting currency shocks to political instability, which matters if households and media respond to depreciation within days or weeks rather than after it appears in quarterly statistics. Second, the specific link tested here (between informal exchange-rate movements and social-unrest-related media activity, as distinct from formal-sector prices or official devaluations) has been the subject of very little direct empirical work, in Cuba or elsewhere. Third, the paper subjects every headline result to six independent robustness checks, including a correction for the 312 hypothesis tests the design generates, a formal joint test on the coefficients themselves, and independent corroboration from ACLED’s field-coded data; a level of scrutiny uncommon in the descriptive event-data literature, and one this paper treats as necessary given how easily a spurious pattern can emerge from a large panel of media-derived series. Fourth, because both the informal exchange-rate series and CSISI update continuously, the approach validated here can, in principle, function as a live monitoring tool rather than a one-time historical exercise.
The rest of the paper builds toward that conclusion step by step. Section 2 reviews the literature connecting currency crises, economic hardship, and unrest, and situates Cuba’s 2021 monetary reform and July 11 protests within it. Section 3 describes CSISI’s construction in full, including why state and exile media are analyzed separately rather than pooled. Section 4 describes how CSISI and its components behave over 2020–2026. Section 5 sets out the empirical estimation of the weekly local-projection specification. Section 6 reports the main results, and Section 7 subjects them to the six robustness checks summarized. Section 8 concludes and presents areas of future work. Three annexes follow: one re-estimates every result under a broader event taxonomy, one under a revised exchange-rate construction, and one examines FX volatility, rather than direction, as a separate channel.
Read the full paper here: https://devtechsys.com/wp-content/uploads/2026/09/INFORMAL-EXCHANGE-RATE-AND-SOCIAL-UNREST_FV.pdf