Most governments around the world agree that the best way to mitigate the crisis is to stop the disease in its tracks, and this implies implementing lockdowns and social distancing measures. Although it is premature to understand the long-term implications of the crisis, there is a sizable amount of information that allows us to understand the immediate impact of the disease in the economy, the government responses, and the vulnerability of the economy to macroeconomic shocks and the measures taken to stop the disease. Nearly as important as generating the information itself, is the ability to transmit it to inform the development of policies, from governmental to businesses and educational institutions, to the behavior of the people whether and how to return to their daily life. For this blog post, I have selected a few data visualization from different sources, which transmit valuable information in a very synthesized way about COVID-19 and economics.
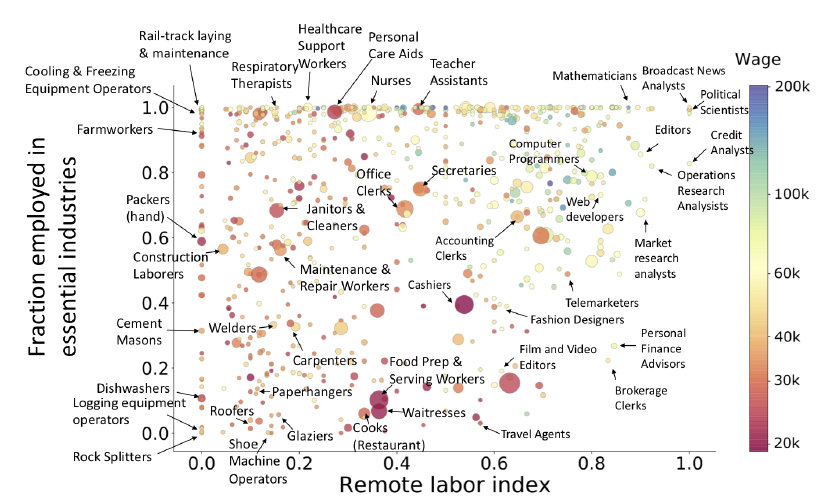
Del Rio-Chanona et al. (2020) estimate the disruptions in the labor market in the US, by combining supply and demand-shocks for different sectors of the economy. A supply shock is determined as a combination of whether the job can be performed from home, and if that job is essential. Jobs that are non-essential and cannot be performed from home have the largest supply shocks. In figure (1), the authors combine four dimensions to produce a very insightful visualization of the supply shock: on the “x” axis, they show what percentage of the job can be done remotely, on the “y” axis, how essential this job is, the size of the circle is the number of employees in that job category, and the color of the circle is the average salary for that job.
Figure 1: Supply shock from del Rio-Chanona
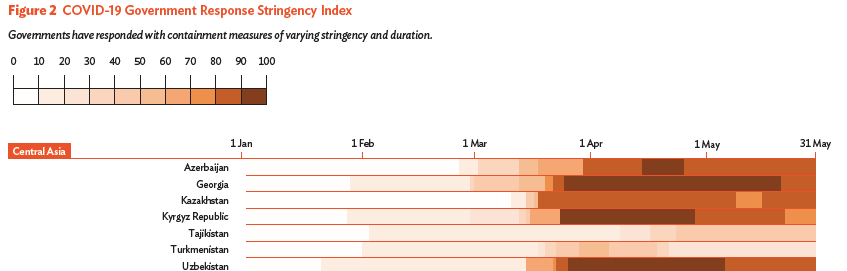
The Asian Development Bank, in its June 2020 Asian Development Outlook Supplement, presented its “Government Response Stringency Index”, which is a composite measure of nine response indicators including school closures, workplace closures, and travel bans, re-scaled to a value from 0 to 100, with 100 being the strictest response. Figure (2) shows an extract of the visualization strategy the ADB uses for its index, which includes three dimensions, the country, the date, and the value of the index with color-coding.
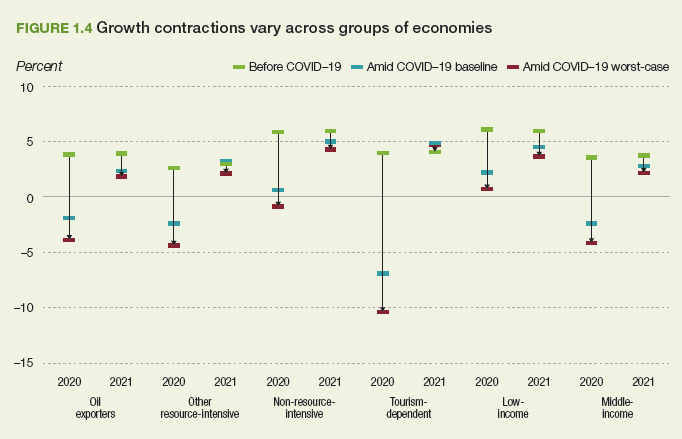
The African Development Bank, in the supplement of the African Economic Outlook, presents its revised estimations of growth amid the COVID-19. In Figure (3), they show the pre-COVID growth estimation for several groups of African countries, and the baseline and worst-case scenarios for 2020 and 2021 growth. This visualization synthesizes a large amount of information in a relatively simple way. For example, we can see the dire situation tourism-dependent countries are facing, and while most of the shock will be faced in 2020, 2021 will still face a reduction in growth compared to pre-COVID-19 levels.
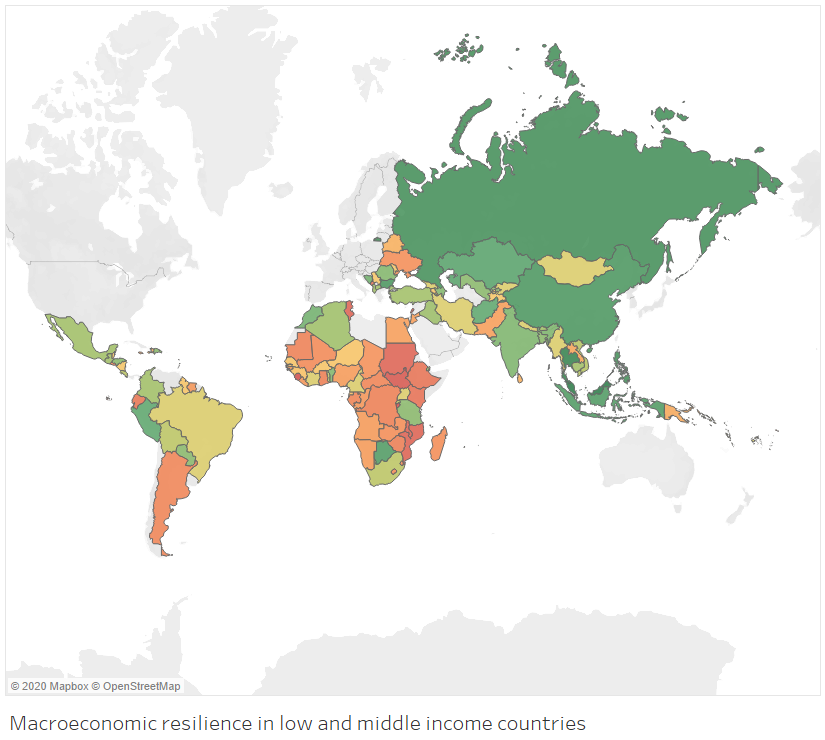
DevTech, through the USAID- Fiscal Accountability and Sustainable Trade (FAST) activity, assessed the macroeconomic resilience of most developing countries by measuring their degree of fiscal and monetary space as an indicator of their ability to respond to shocks, such as COVID-19, and implement fiscal and monetary policies to neutralize or ameliorate them. This assessment combined 14 indicators of fiscal and monetary resilience into a composite index of resilience. In Figure (4), we can find the geographical distribution of this index, being green the most resilient developing countries and red the least. In general, there is a strong geographical face to macroeconomic resilience; with Africa being less resilient, South East Asia more resilient, and Latin America, Central Asia, and Eastern Europe in between.
References:
Asian Development Bank. (2020). Asian Development Outlook 2020 Supplement: Lockdown, Loosening, and Asia’s Growth Prospects.
African Development Bank. (2020). African Economic Outlook 2020 – Supplement.
del Rio-Chanona, R. M., Mealy, P., Pichler, A., Lafond, F., & Farmer, D. (2020). Supply and demand shocks in the COVID-19 pandemic: An industry and occupation perspective.
USAID Fiscal Accountability and Sustainable Trade. (2020). COVID-19 Macroeconomic Resilience.