
The “Tax System from 30,000 Feet” methodology provides a high-level view of a country’s tax system. The methodology, developed by Dr. Mark Gallagher, is based on the systematic comparison of a country’s tax system indicators with the average values from around the world, from the region, and sometimes with other specific countries. Data sources to generate these reports vary depending on the country of interest and the needs of the analyst. A good one-stop data source to generate these reports is the USAID’s Collecting Taxes Database (CTD), maintained by the USAID’s Analytics, Data, Visualization, and Information Services (ADVISE), implemented by DevTech Systems.
USAID and its partners have been using this methodology to generate quick reports and have a high-level view before conducting a more comprehensive approach to diagnose a tax system, such as a Tax Benchmarking Study.
The 30,000ft report can be generated within a reasonable timeframe by an analyst. However, the USAID’s Fiscal Accountability and Sustainable Trade (FAST) is currently working with its ADVISE colleagues to develop a user-friendly dashboard to instantly generate the tables and graphs used in the report, for any given country and regional comparators.
Indicators
Indicators usually included in a 30,000ft report are the following (1):
- VAT Rate. This is the general rate at which most goods and services are taxed under the value-added tax (VAT).
- VAT Gross Compliance Ratio (GCR). This indicator is the ratio of actual VAT collections in a country to the potential revenues from applying the standard VAT rate to Private Consumption Expenditure. In principle, a VAT with no exemptions, a single rate, and full compliance should result in efficiency ratios of close to 100 percent.
- VAT Efficiency Ratio. This indicator measures of VAT productivity found in the CTD. It is calculated as the ratio of actual VAT collections in a country to the potential revenues which derive from applying the standard VAT rate to GDP. In principle, a VAT with no exemptions, a single rate, and full compliance should result in efficiency ratios of close to 100 percent.
- Corporate Income Tax Rate. This is the general rate of the Corporate Income Tax (CIT). In most countries, only one corporate income tax rate is applied to corporate profits.
- Corporate Income Tax Productivity. CIT productivity is a performance indicator that represents how well the corporate income tax does in terms of revenue collection, given the tax rate. It is calculated as the ratio of CIT revenue (as a percentage of GDP) to the CIT rate.
- Personal Income Tax Minimum Rate. The minimum personal income tax rate is the lowest non-zero positive tax rate applied under a country’s personal tax system.
- Personal Income Tax Maximum Threshold. This is the maximum level of income at which the highest marginal personal income tax rate applies, expressed as a ratio of GDP per capita.
- Personal Income Tax Productivity. PIT productivity is calculated as the ratio of PIT revenue (as a percentage of GDP) to the weighted average PIT rate. The weighted average PIT rate is the weighted average of the lowest and highest marginal personal income tax rates, given the income level at which each rate kicks in.
- Number of Employees of the Tax System (Tax Staff). This is a measure of the country’s tax administration workforce relative to the population of the country. It is measured as the number of tax administration employees per 1,000 people.
- Number of Taxpayers in the country to Number of Employees of the Tax System. This indicator measures the number of taxpayers in the country relative to the size of the tax administration’s staff.
- Tax Effort. Defined as the ratio between the actual tax revenue as a percentage of GDP to the predicted Tax Capacity of the country.
- Cost of Tax Collection. This performance indicator is the ratio of the cost of administering the tax system to the total revenues collected by the tax administration. The lower this indicator is, the more efficient the tax system.
Systematic Comparison
For each indicator, the 30,000ft report shows the latest value for the country of interest, the average for the region and the world. Other information included are the standard deviations, minimums, maximums, and number of observations. This information is usually shown in a table format. The report also includes a histogram per indicator, showing where the country is compared to its peers or the world, and a line chart showing how the indicator has evolved in recent years.
For example, for PIT Productivity for Cambodia (2017), the report would contain the following table and graphs:
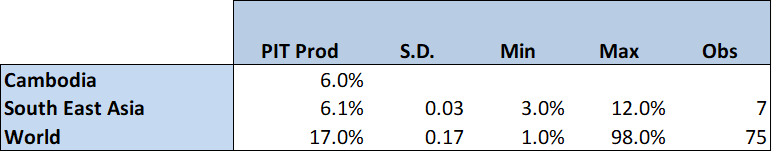
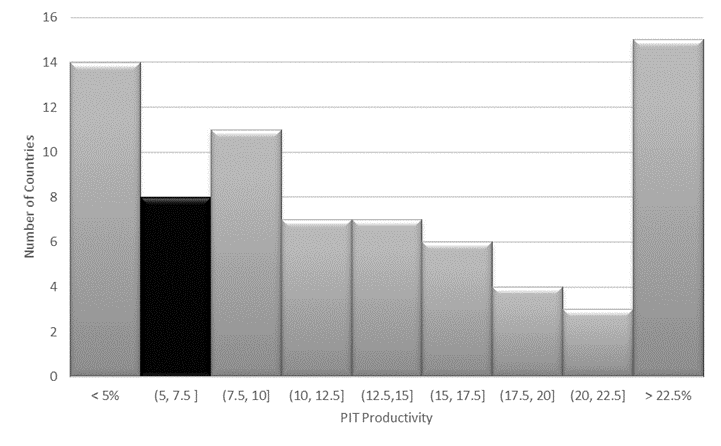
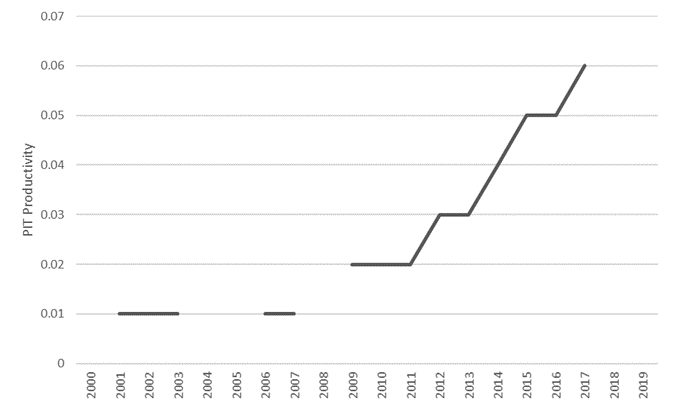
From this information, we know that the PIT productivity of Cambodia is low compared to the rest of the world, but similar to other countries in South East Asia. We can also observe that the PIT productivity has been steadily increasing since 2009.
The indicator-by-indicator analysis is complemented by a summary of findings, in which the analyst points out the general performance of the tax system, and the strengths and weaknesses of the system based on the observed data.
References:
- Definitions are taken from the USAID’s CTD technical note https://idea.usaid.gov/domestic-revenue-mobilization